Sensor Nodes
Intro
For measuring the temperature, humidity and many more metrics around the house i needed to have a way to send me all sort of information via preferably WiFi.
The hardware and software
My initial thoughts were to get some kind of ESP8266 chip and use this for the measuring of the metrics. This brought me to some experimenting with sensors, ESP8266 Controllers and breadboards. Finally after some testing and creating test PCB’s i came up with a design which just works for multiple type of sensors. With this design i went to a friend of mine who made me a decent PCB design.
The PCB’s were ordered with DirtyPCB’s and in the meanwhile i further finalised my firmware. The result is published on Github :
https://github.com/Miepermans/esp8266-InfluxDB-dht22-Datalogger
https://github.com/Miepermans/esp8266-InfluxDB-ds18b20-Datalogger
With the current release of the firmware, on first boot a AP is created, on which you can join with any type of device. You will be prompted with a captive portal next. In this captive portal you have to fill in the final SSID, Password and you will also be able to fill in information about the logging server.
Server Setup
I have chosen to use Grafana for displaying statistics. This was already used for some network monitoring around my house so it was an obvious choice. Grafana is an open source, really awesome graphing web GUI. Whatever you can think of, it’s possible with Grafana.
I needed to feed some data into Grafana, to do this ( Grafana is only a graphing tool ) i needed some kind of service to store my measurements. Initially i worked with Graphite before, but there are some disadvantages with Graphite which made it not so ideal for time based metrics. Also, the intergration you would have to make on the ESP8266’s would be to heavy weight for the microcontrollers.
After some searches i found InfluxDB. InfluxDB is a pretty lightweight time-based series database. It’s really easy to setup and, with some additional configuration can easily listen on a UDP port on the server ( default UDP/8089 ).
After pushing some data to InfluxDB i could make a nice dashboard like below:
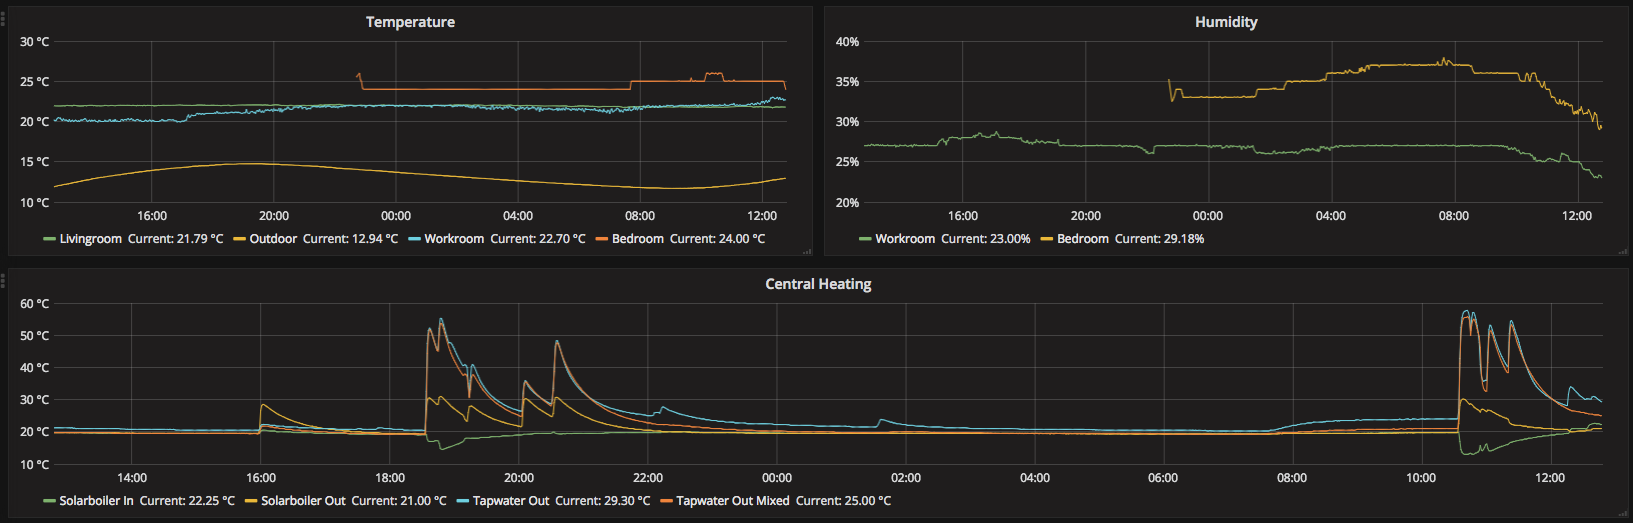
As you might notice, I’m not only logging the temperature and humidity of my house. Because of some issues with the central heating i have attached some sensors to the inlets and outlets of the central heating system in my house.
Currently i started using my new PCB’s in the bedroom and for testing. The other metrics are already collected from around 4 weeks now.
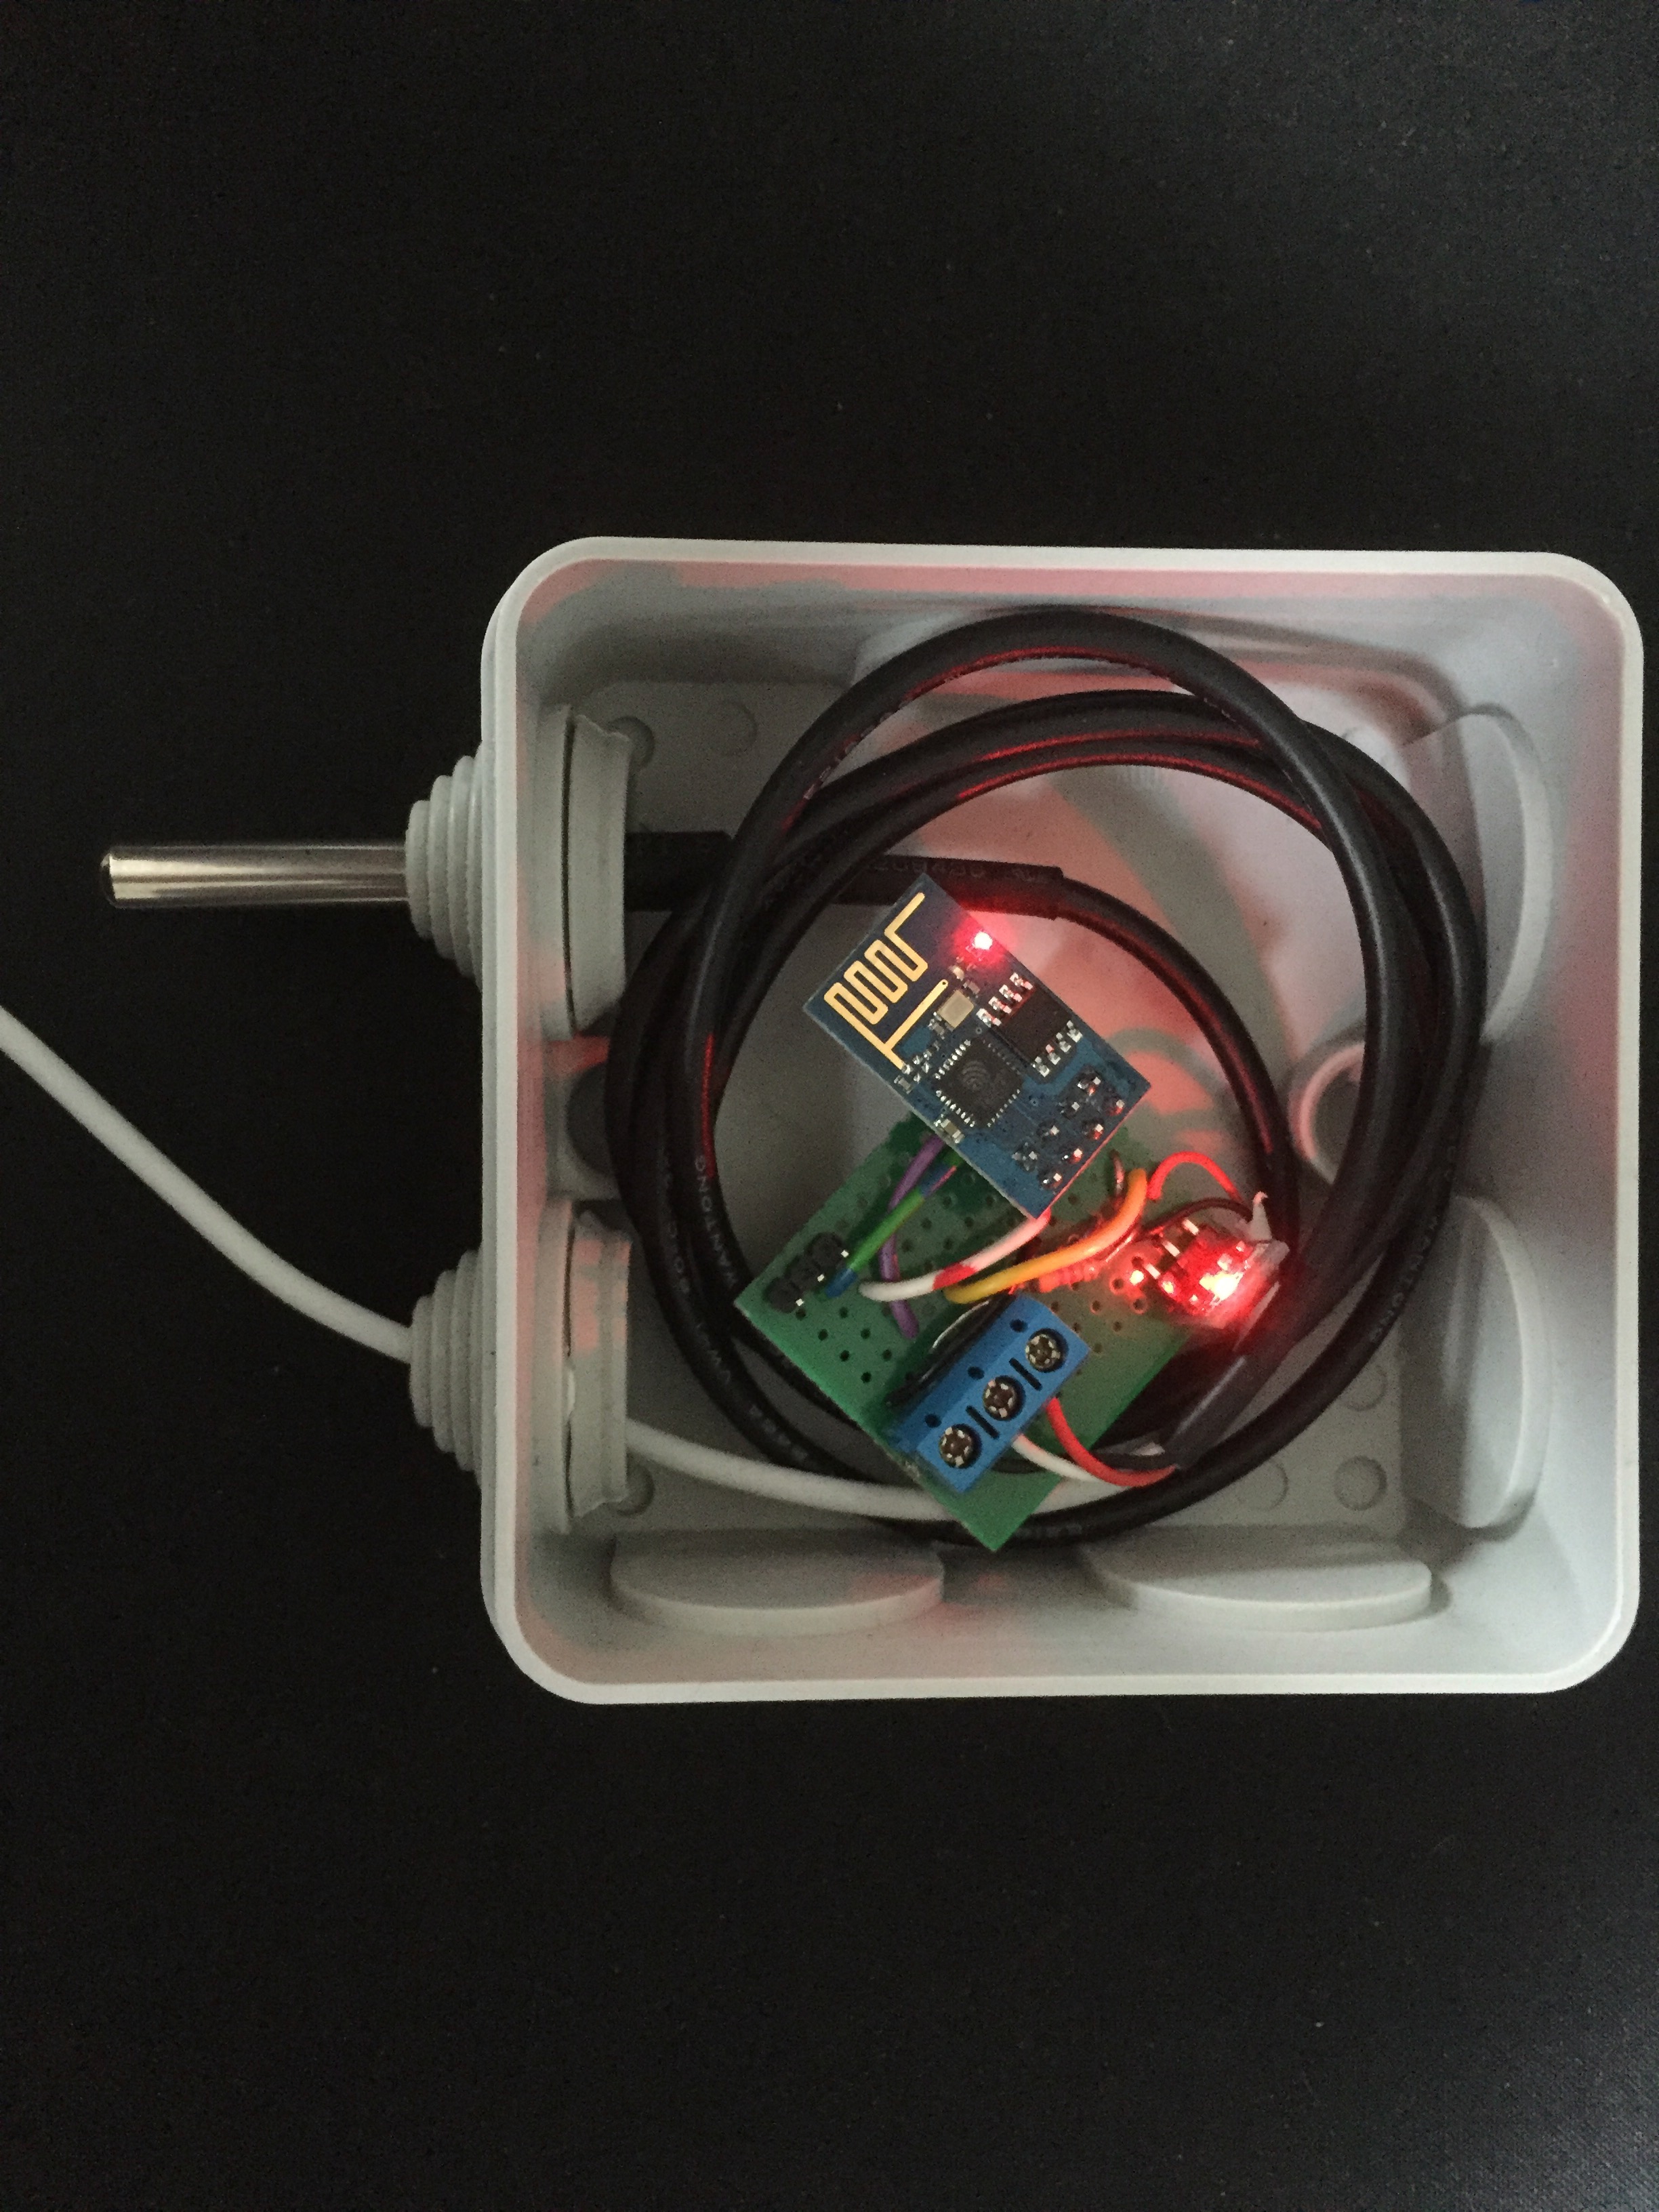
This picture shows one of my test PCB’s:
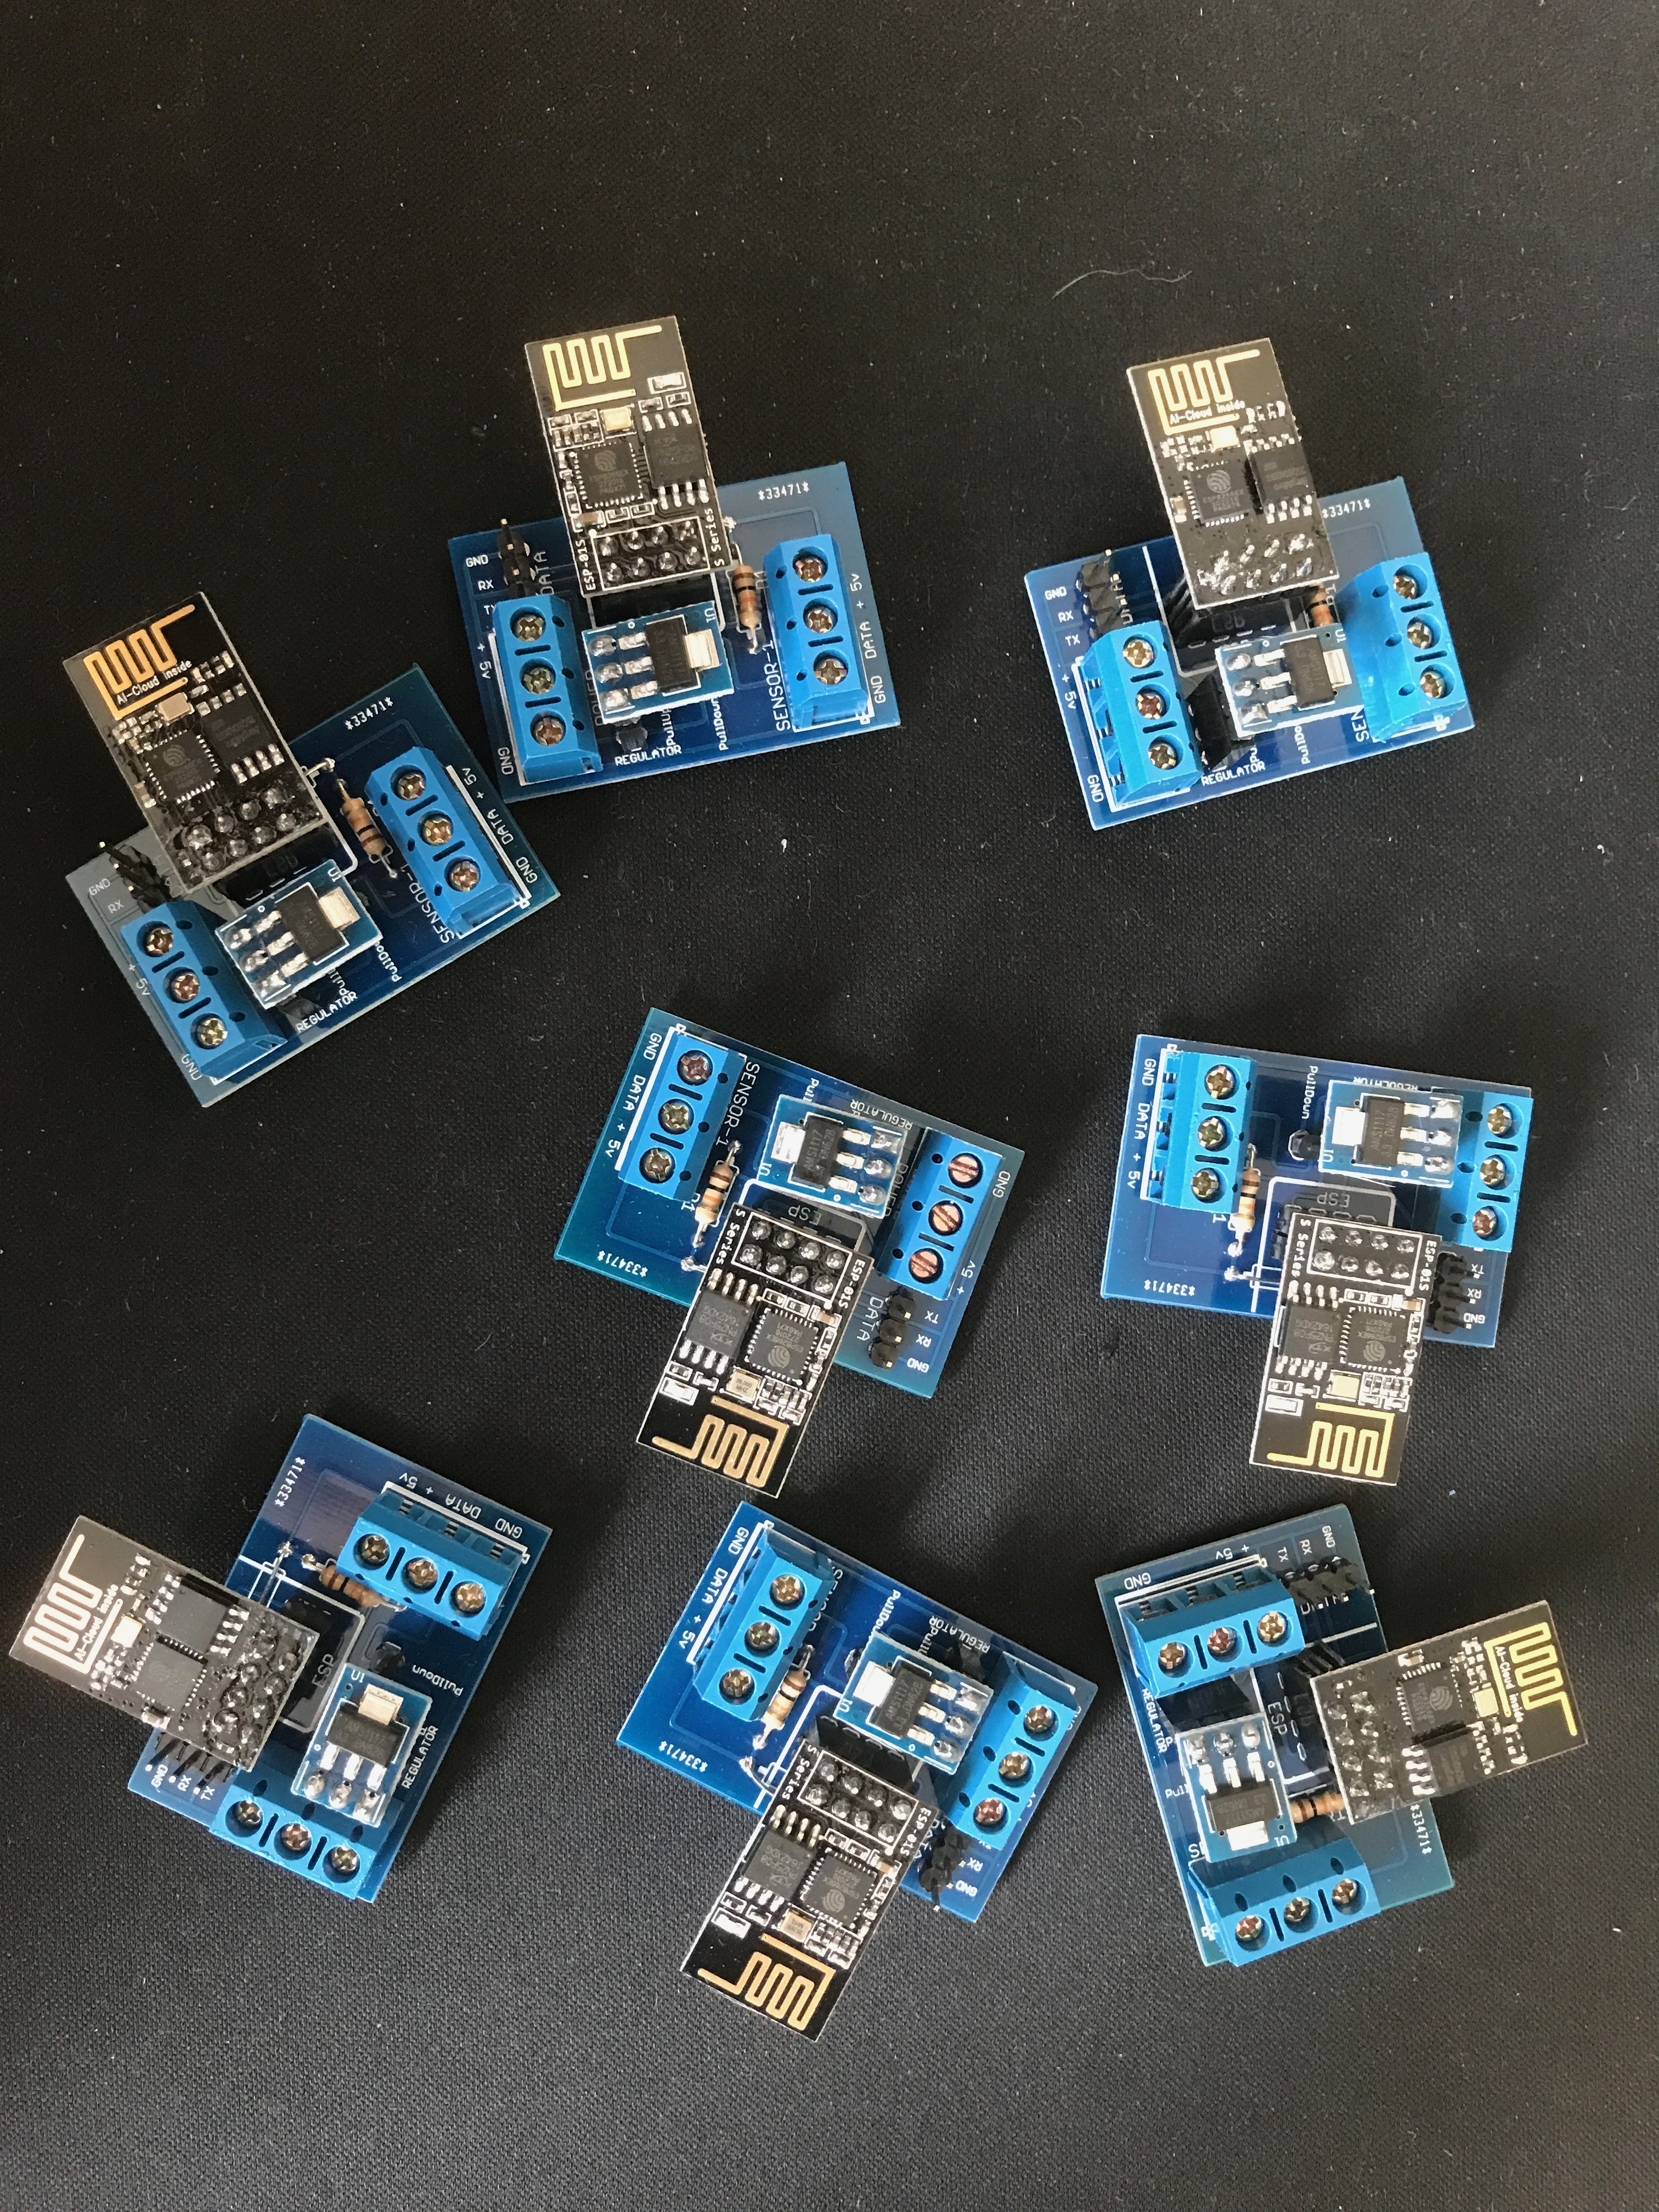
Picture with some of the sensor boards with a very cheap ESP-01 ( smallest ESP8266 board available ) attached to it:
And, the finalised product ( please also note the cheap version of the DHT22 sensor )
